Hurricanes have been a recurring challenge for North Port, Florida, and the surrounding areas. Each storm leaves a distinct mark, affecting water levels in the rivers and causing varying degrees of flooding. In this analysis, we’ll compare the water gauge data following Hurricane Ian (2022) and Hurricane Helene (2024) (before the anticipated arrival of Hurricane Milton (2024)). We’ll also draw valuable insights from previous storms, including Hurricane Charley (2004) and Hurricane Irma (2017), which had significant impacts on the region.
The Hurricanes: Context and Impact
Hurricane Ian (2022)
Hurricane Ian, one of the most devastating storms to hit Southwest Florida in recent years, made landfall as a Category 4 hurricane. Its impacts on North Port were profound, with extreme storm surge, torrential rainfall, and widespread flooding. Rivers such as the Myakka and Peace Rivers surged to historic levels, causing sustained flooding throughout the region.
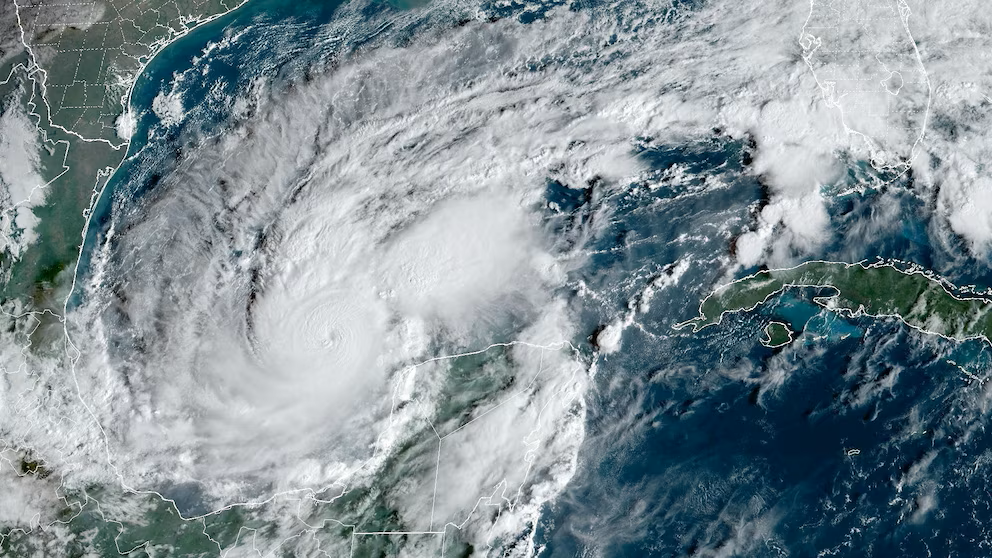
Hurricane Helene (2024)
Earlier in 2024, Hurricane Helene impacted the North Port area, bringing significant rainfall, but without the same catastrophic effects as Ian. Water levels rose but not to dangerous extremes, and the region saw a relatively quick recovery. As North Port prepares for Hurricane Milton (2024), understanding how waterways responded to Helene offers important insight into the area’s current resilience and vulnerability to additional storms.
Hurricane Charley (2004)
Hurricane Charley made landfall as a Category 4 storm in 2004, delivering a concentrated punch of wind damage and storm surge to the region. Charley moved through quickly, limiting the amount of flooding it caused despite its power. The fast-moving nature of Charley resulted in sharp but brief rises in water levels, making it a useful point of comparison for storms that linger, like Ian.
Hurricane Irma (2017)
Hurricane Irma, a Category 3 storm that passed through Southwest Florida, brought widespread wind damage and heavy rains, causing significant flooding in some areas. Irma’s immense size meant that its effects were felt across a large swath of Florida, including North Port. Though Irma’s storm surge wasn’t as severe as Ian’s, it caused river levels to rise significantly, and local flooding persisted for days.
Water Gauge Height Comparison
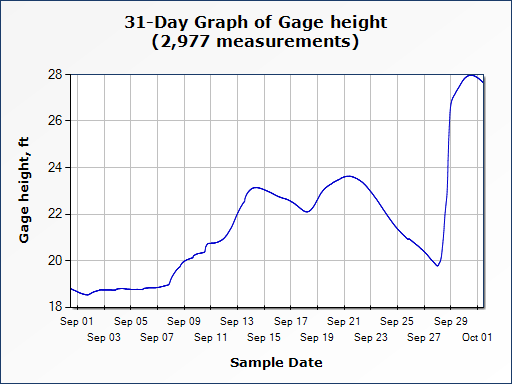
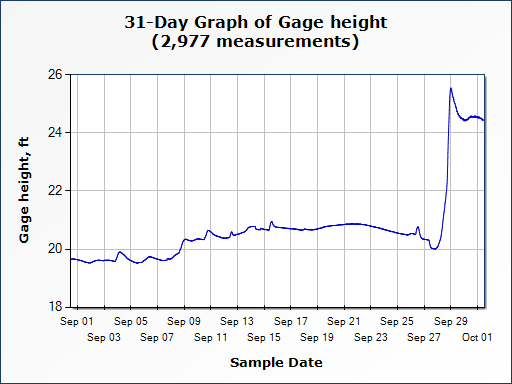
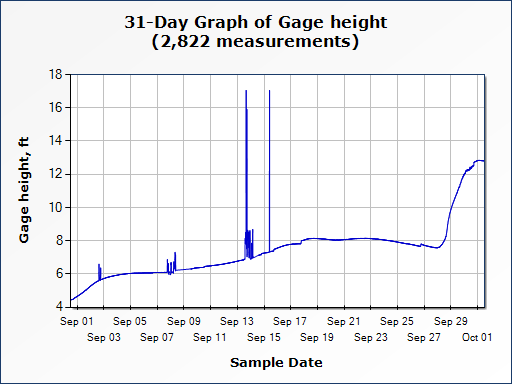
Graph 1: Post-Hurricane Ian (2022)
The first graph shows water gauge data following Hurricane Ian. Key takeaways include:
- Record Water Levels: The rivers around North Port, particularly the Myakka and Peace Rivers, saw water levels spike to 20 feet or more above normal. Ian’s heavy rainfall and storm surge overwhelmed drainage systems, leading to severe, widespread flooding.
- Prolonged Flooding: Water levels remained high for 10-14 days after Ian. This extended flooding caused significant delays in recovery efforts, with some areas remaining underwater long after the storm had passed.
- Slow Recovery: Rivers took up to three weeks to return to normal levels, highlighting the scale of the flooding and the challenges in draining the excess water from the area.
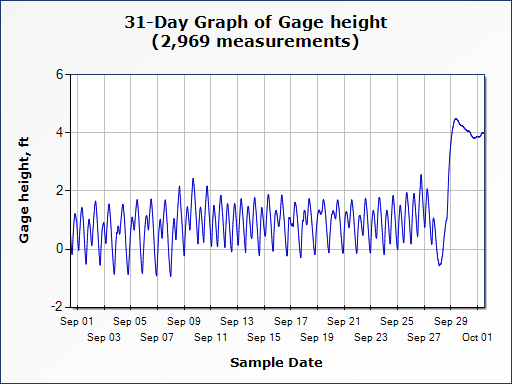
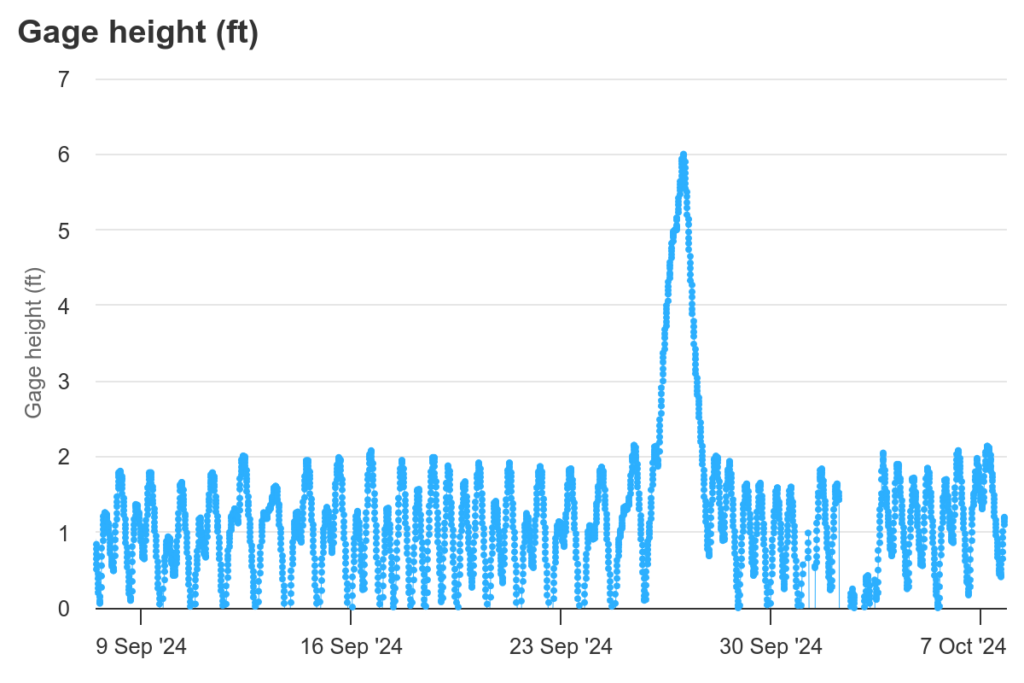
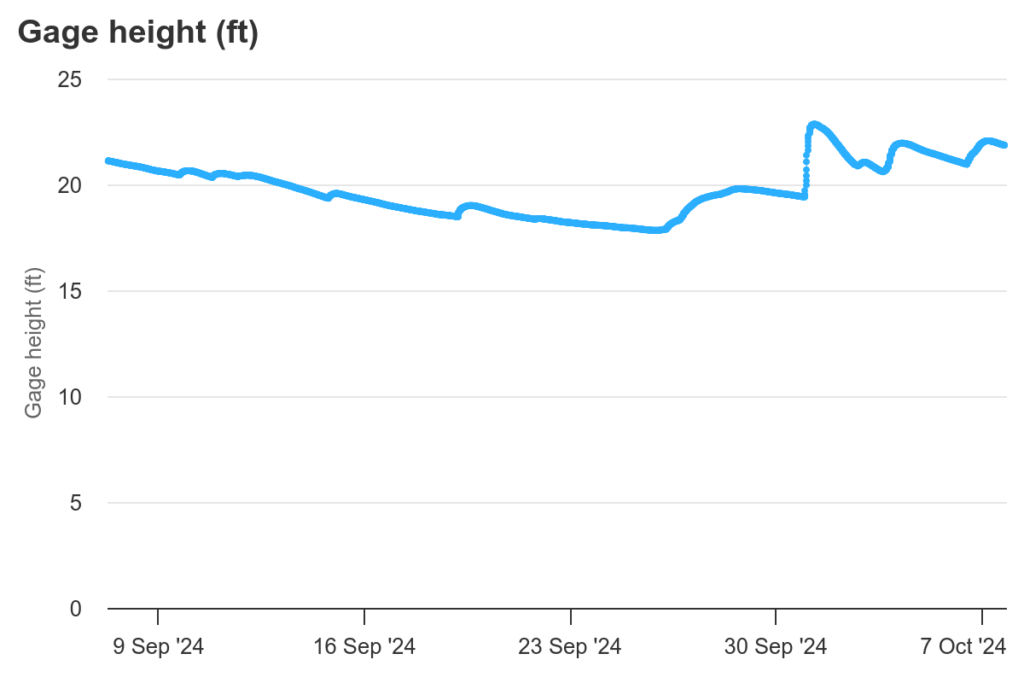
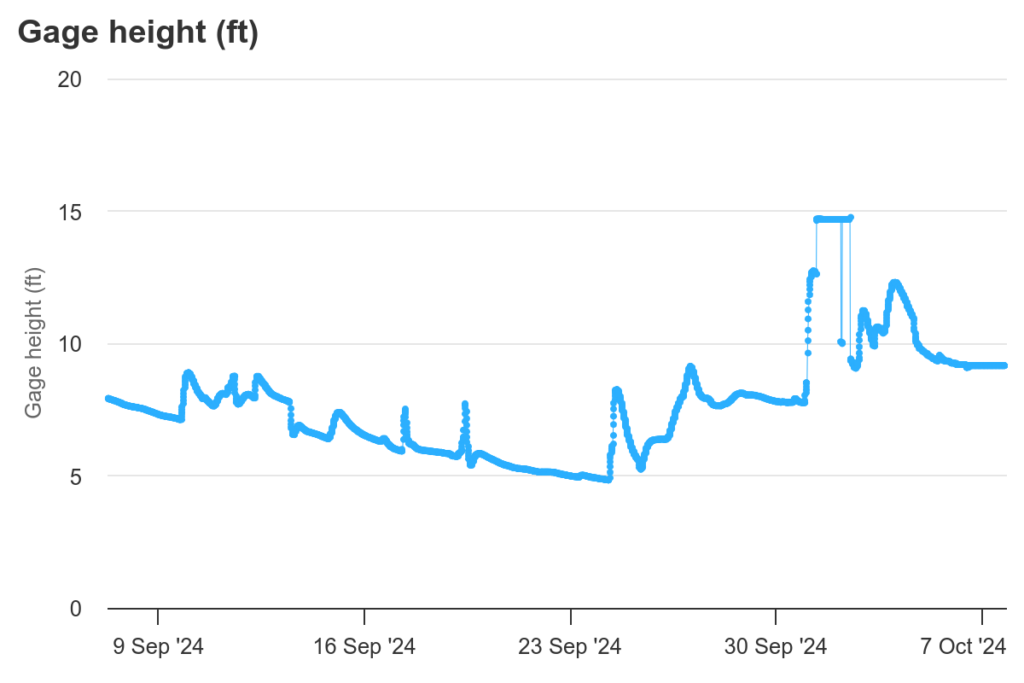
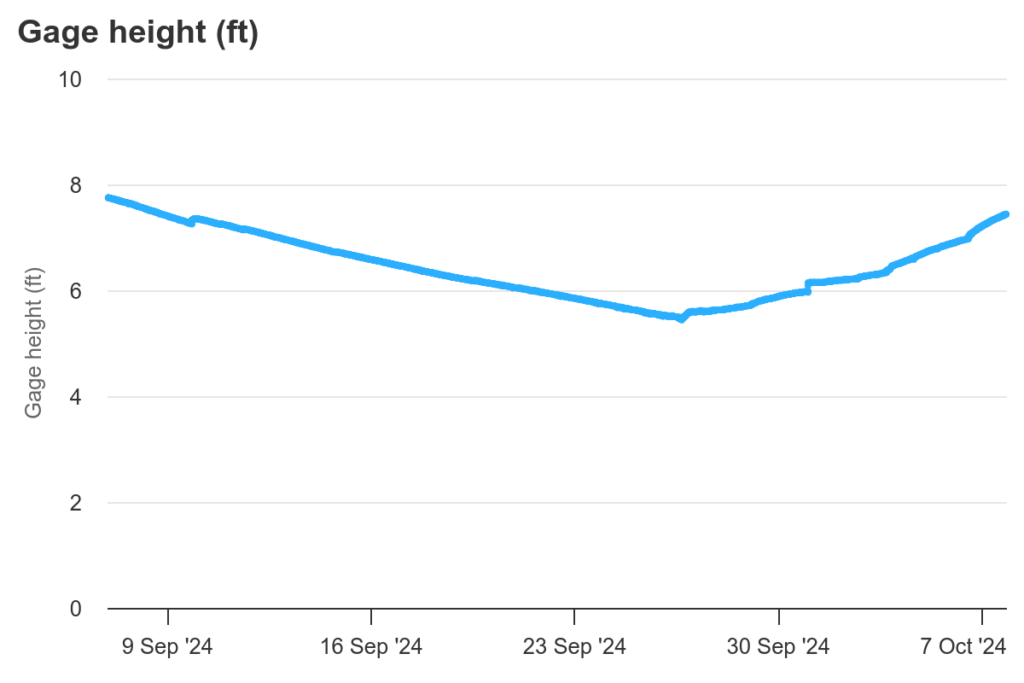
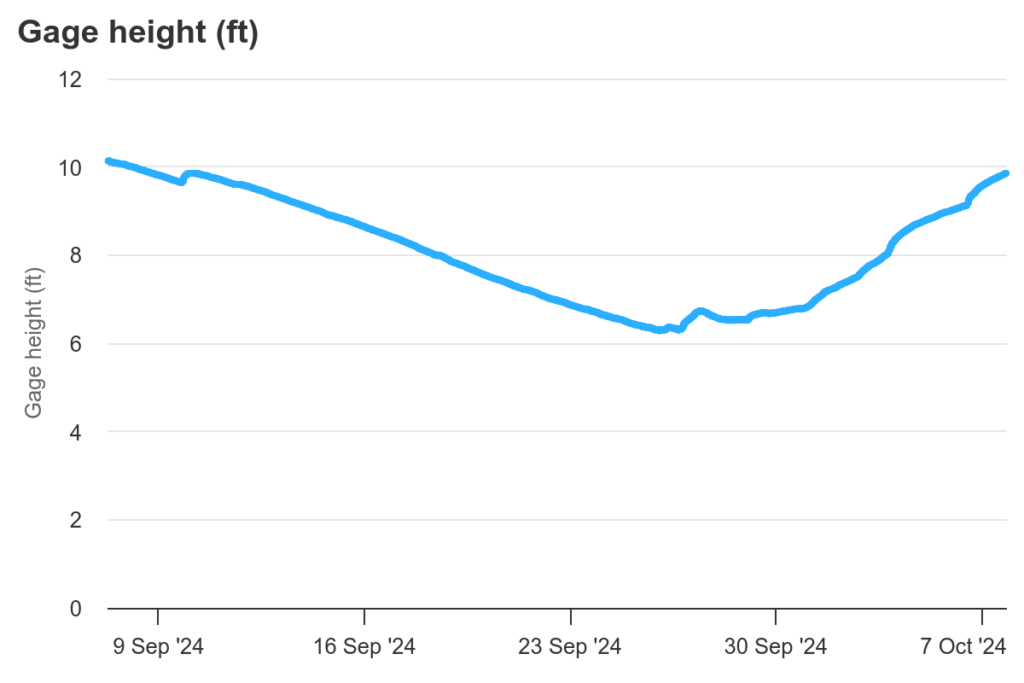
Graph 2: Post-Hurricane Helene (2024), Pre-Hurricane Milton
The second graph displays water gauge data after Hurricane Helene but before the anticipated arrival of Hurricane Milton. Important observations include:
- Moderate Water Level Rise: Helene caused water levels to rise by 2 to 5 feet, which, though significant, was far less than the spike seen after Ian. The flooding was more localized and manageable.
- Quick Recovery: The rivers returned to normal within 3 to 5 days, suggesting that the area’s water systems handled Helene’s rainfall effectively. This relatively fast recovery is important as the region braces for Hurricane Milton.
Historical Context: Hurricane Charley (2004)
Charley’s impact on North Port in 2004 was characterized by extreme wind damage but comparatively less flooding. The storm’s rapid movement limited its rainfall and allowed water levels to return to normal quickly. Charley’s storm surge did cause some brief rises in river levels, but the flooding was much more localized and short-lived compared to Ian.
Historical Context: Hurricane Irma (2017)
Irma’s immense size brought significant rainfall across the region, including North Port, leading to moderate but persistent flooding. The water levels rose considerably, though not to the same heights seen during Ian. After Irma, some rivers took up to a week to return to normal, especially in areas where heavy rainfall accumulated in low-lying regions. The water gauge data for Irma would have shown a 5-10 foot rise in water levels, with recovery slower than Charley’s but faster than Ian’s.
Key Comparisons and Insights
1. Flood Severity
Hurricane Ian caused the most severe flooding, with water levels surging dramatically and staying elevated for weeks. Charley, while extremely destructive, moved quickly enough to avoid prolonged flooding. Irma’s impact on water levels was somewhere in between significant, but not as catastrophic as Ian’s. Helene caused more moderate flooding, which was quickly managed.
2. Flood Duration
Flooding after Ian persisted for much longer compared to Charley, Helene, or even Irma. Ian’s prolonged impact, with high water levels lasting up to three weeks, stands in stark contrast to Charley’s brief flooding and Helene’s rapid recovery. Irma caused a more moderate flooding period, with recovery times closer to a week.
3. Post-Storm Recovery
Post-Ian recovery took much longer due to the scale of the flooding, while rivers returned to normal more quickly after Helene, Charley, and Irma. Helene’s quick recovery offers hope that the region’s waterways are currently more resilient and ready to handle future storms like Milton, provided they don’t bring the same deluge as Ian.
4. Baseline Conditions for Milton
The post-Helene data provides a useful baseline for assessing the current state of the region’s rivers and water systems. With water levels back to normal after Helene, the waterways are in a better state to handle Milton’s potential impacts. However, given the lessons from Ian, Charley, and Irma, there remains a risk of severe flooding if Milton brings heavy rainfall and storm surge.
Conclusion
The comparison between water gauge data from Hurricanes Ian, Helene, Charley, and Irma underscores the varying impacts these storms have had on North Port’s waterways. Hurricane Ian caused extreme, prolonged flooding that took weeks to recede, while Helene, Charley, and Irma, though impactful, allowed for faster recovery.
As the community watches Hurricane Milton (2024) approach, the lessons from these past storms are invaluable. Charley’s brief but intense impact, Irma’s widespread but moderate flooding, and Ian’s catastrophic surge all highlight the importance of preparing for different types of storms. North Port’s waterways are currently stable post-Helene, but the region must remain vigilant, ready to respond to whatever challenges Milton may bring. Understanding water gauge data and historical trends will be key in mitigating future flooding and ensuring the community’s resilience.
Water Gage Height Comparison
10/01/22 vs. 10/07/24
Big Slough – Tropicaire Blvd

Big Slough – Price Blvd.
Myakka River – Alligator Bridge
Myakka River – Laurel, FL

Myakka River – US 41 North Port, FL